Computational Fluid Dynamics (CFD) Services
CFD modeling to predict performance, visualize flow, and solve complex hydraulic and piping challenges
Primary Flow Signal has partnered with the Utah Water Research Laboratory (UWRL) offering CFD services. UWRL has a depth of expertise in numerical modeling utilizing CFD. This powerful tool is capable of assisting individuals solve their complicated flow problems and identify performance characteristics. CFD solves the very complex Navier-Stokes equations which describe viscous fluid motion.
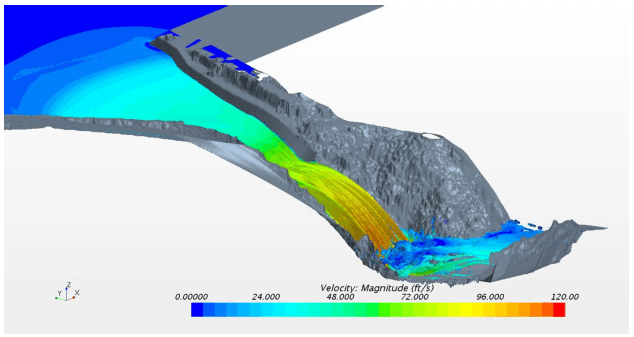
Using state-of-the art software (Star CCM+) coupled with cloud or local computing resources, very large problems including reservoirs, associated spillways or complex piping systems can be solved. With the ability to simulate multi-phase fluids, particularly when dealing with the air-water interface of free surface flows, it is possible to visualize flow patterns, identify hydraulic concerns, propose solutions to improve performance and insure that those solutions will perform as expected.
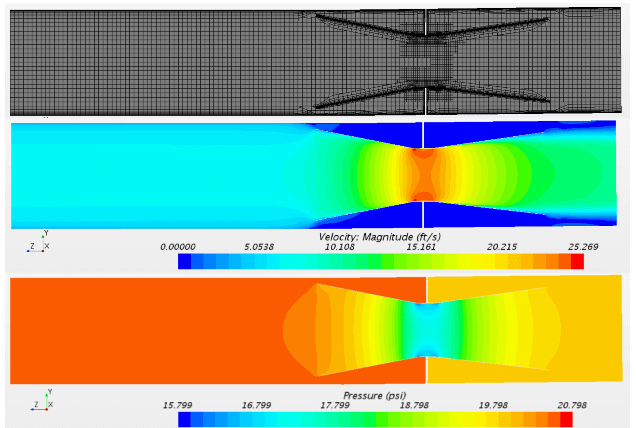
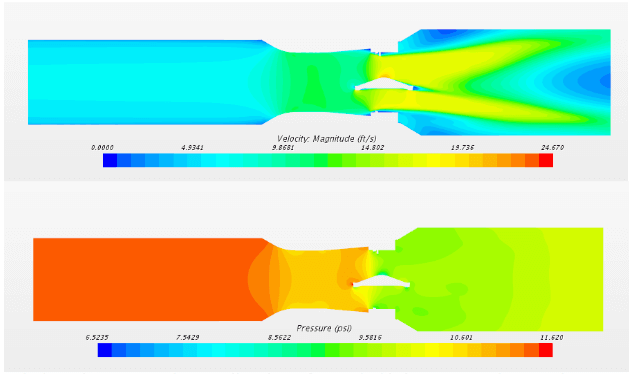
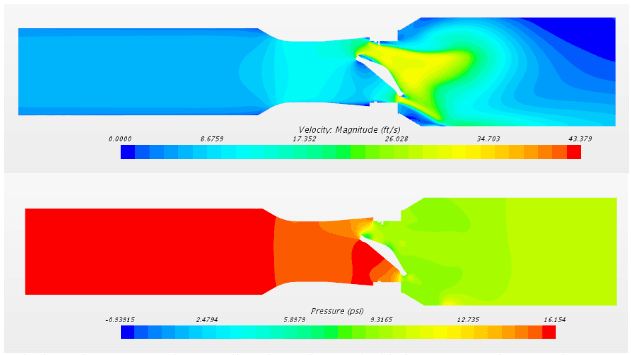
In addition to solving free-surface flows, personnel at the UWRL have solved many closed conduit flow problems including those associated with flow meters, valves, pumps, fire hydrants and problems involving viscous liquids or hydraulic conditions not feasible to simulate in the laboratory environment. Flow visualization, pressure distributions and flow and discharge coefficients are readily obtained using Computation Fluid Dynamics.
Recently, CFD has been used to evaluate flow over several large spillways and outlet works of some significant dams in the United States. In addition, the tool has been used to investigate the impact of adverse piping conditions on flow meter and valve performance as well as pump and intake structure performance.
Benefits of Computational Fluid Dynamics Modeling:
- Predict performance before you build or modify anything:
Evaluate flow meters, valves, pumps, hydrants, and other flow control or measurement devices under real operating conditions. - Confidence in coefficients and accuracy:
Predict discharge and flow coefficients to within 0.5% or better for the right applications and setups. - Create rating curves for hydraulic structures:
Develop rating curves for spillways and other control structures to support design decisions and operational planning. - See what you cannot measure in the field:
Extract pressure and velocity at any point in the model and generate contour plots on any plane to visualize flow patterns, losses, and problem areas. - Full scale modeling removes scaling effects:
Model at full scale to avoid the scaling limitations that can affect physical models. - Fast, cost effective results:
Get actionable outputs in days, not weeks, with rapid iteration when comparing design options or troubleshooting issues. - Quantify forces and loads from flowing fluid:
Extract and resolve forces on components to support structural decisions, anchoring, supports, and durability improvements.
CFD Examples at the UWRL: