Exploring Wide Range Flow Metering with Differential Pressure Technology and Modified Venturi Tube Design
By: Bruce Briggs, President, Primary Flow Signal
Introduction to Wide Range Flow Metering and Differential Pressure Technology
Today, more than ever, the requirement for accurate and reliable flow measurement is on the top of every process design list. One of the difficult issues that designers face is the increasingly wide minimum-to-maximum flow rates that they are required to plan for. A major reason that wide range measurement is of greater concern is the significant increase in both the cost and value of many measured commodities.
For example, in the water processing market, raw water is at historically low supply levels. Due to this shortage, there is a growing need to document each step in the water processing chain to be certain that intake and finished water totals can be accurately compared to distributed and consumed water totals. This requires monitoring over a minimum-to-maximum flow rate range that is much wider than previously required. Another change in philosophy, because of the excessively high costs associated with new plant construction, is that new water plants are not being built nearly as often as older facilities are being upgraded, expanded, and modernized. This trend will continue and has already begun to modify the most frequently-used design philosophy concerning minimum-to-maximum flow rate range.
On the industrial side, chemical refining, oil and gas production, and plant process control systems are noting the same “stretching” of the range as facility engineers are required to increase and decrease production rates according to demand. The challenge is to have a process that is scalable so that when demand is high, opportunities are not lost; and when demand drops, costs can be controlled.
For the most part, all flow metering technologies claim some degree of range in their specifications along with an accuracy statement that is, in many cases, affected by the minimum –to-maximum flow rate range that the system operates under. The process engineer is, today, challenged more than ever before with:
- determining what the true range requirements are;
- determining which measurement technology meets that requirement; and
- carefully considering all of the error sources ‒ one of which is range ‒ so that an integrated system accuracy analysis can be developed and used to confirm that the equipment selected based on the flow rate range can meet the system accuracy requirement.
Design and Operational Advantages of Modified Venturi Meters
For years, the range attributed to Venturi meter performance has been incorrectly stated to be 3:1 or 5:1 on flow when, in actuality, the true range of the modified, short form Venturi meter can be 50:1 or 100:1 or greater because the largest error source is developed by the differential pressure transmitter. As seen in the following examples, using the correct differential pressure transmitter model, including multiple transmitters in a system, can result in far wider ranges than previously thought.
Consideration for using a modified, short form Venturi should be based on a number of operational advantages of this technology. With a factory bench calibration, modified Venturi meters have a basic accuracy of +/- 0.5%. When a laboratory flow calibration is applied, modified Venturi meter accuracy is improved to +/- 0.25%. These accuracies can be maintained across a wide flow rate range, making it a more versatile choice for many different applications.
Additionally, they:
- are tolerant of short upstream piping configurations;
- don’t require straight pipe downstream piping;
- have very low energy consumption (headloss) and minimal impact on overall line pressures;
- have flexible meter length and end connection configurations to suit application space and end connection requirements; and
- can accurately measure all types of materials, such as sludge, slurries, tar sand, and many others using sealed diaphragms to isolate the process from the differential pressure transmitter, thus eliminating any potential for plugging the impulse lines.
Venturi meters have a usable life expectancy of 100 years or more based upon material selection.
What’s unique about differential pressure meters, unlike electronic meters, is the stated accuracy can be virtually guaranteed for the life of the meter, assuming no dramatic changes in flow condition or with the physical geometry of the internal profile. An expert assessment of a Venturi’s condition – such as the Internal Condition Assessment System offered by Primary Flow Signal – means that it can be easily determined if there is any change to the internal profile of the Venturi meter that impacts its accuracy without internal inspection.
The Role of Differential Pressure Transmitters in Flow Metering
When using a differential pressure based, wide range metering system, there are two basic components and several application conditions to consider. The prime measurement device is the Venturi meter, which is commonly referred to as the flow “primary”. The differential pressure transmitter senses the high and low pressure that the Venturi meter develops and converts the input “differential pressure” to an electronic output signal which generates rate and total results. The differential pressure transmitter is therefore called the “secondary” part of the system.
When designing a differential pressure wide range metering system, it’s important to adhere to the following process:
- Analyze process conditions that impact on the design of the Venturi meter, such as available line pressure, low pipe Reynolds number conditions, and differential development at the minimum flow rate, to be certain the differential pressure is high enough for the differential pressure transmitter to sense and process but not excessively high at the maximum flow rate.
- Next review what the accuracy requirement is that must be achieved for the total metering system (primary and secondary) so that the accuracy statement becomes an integrated +/- system value at the indicator/totalizer. Once the target system accuracy is established, analyze what differential pressure transmitter accuracy is required and how many transmitters will be used to cover the wide range application. When selecting the correct differential pressure transmitter model, take into consideration what the maximum differential produced by the Venturi meter will be at the maximum flow rate so that the right differential pressure transmitter range code can be selected.
To illustrate the previous point, Figure 1 shows an example taken from a commonly used Rosemount 3051CD Differential Pressure Transmitter with a selected range of 0 -250 inches of water column. However, at start-up the transmitter is calibrated to what the maximum differential of the application would be (plus a small buffer) of 154.35 inches of water column = 20.0 mA output signal from the transmitter. Typically, most people would calibrate the transmitter for figure 1 to 165.0 so that any excursion beyond the assumed maximum flow rate of 2600 GPM would be accurately reported.
Case Study: Implementing Wide Range Metering Systems
Let’s take a look at how a wide range system performs based on the PFS-Halmi Venturi Tube, which is a modified, short form Venturi meter and a state-of-the-art differential pressure transmitter based on a minimum-to-maximum flow rate range of 8:1 on flow.
Once the application conditions and accuracy requirements noted above have been analyzed and the Venturi meter design that best suits those requirements has been defined, process engineers can use a System Accuracy Profile (such as the one in Figure 1) to visualize how the metering system (primary and secondary equipment) will perform. Figure 1 is an example of a standard range (8:1) Venturi metering system with a single differential pressure differential pressure transmitter.
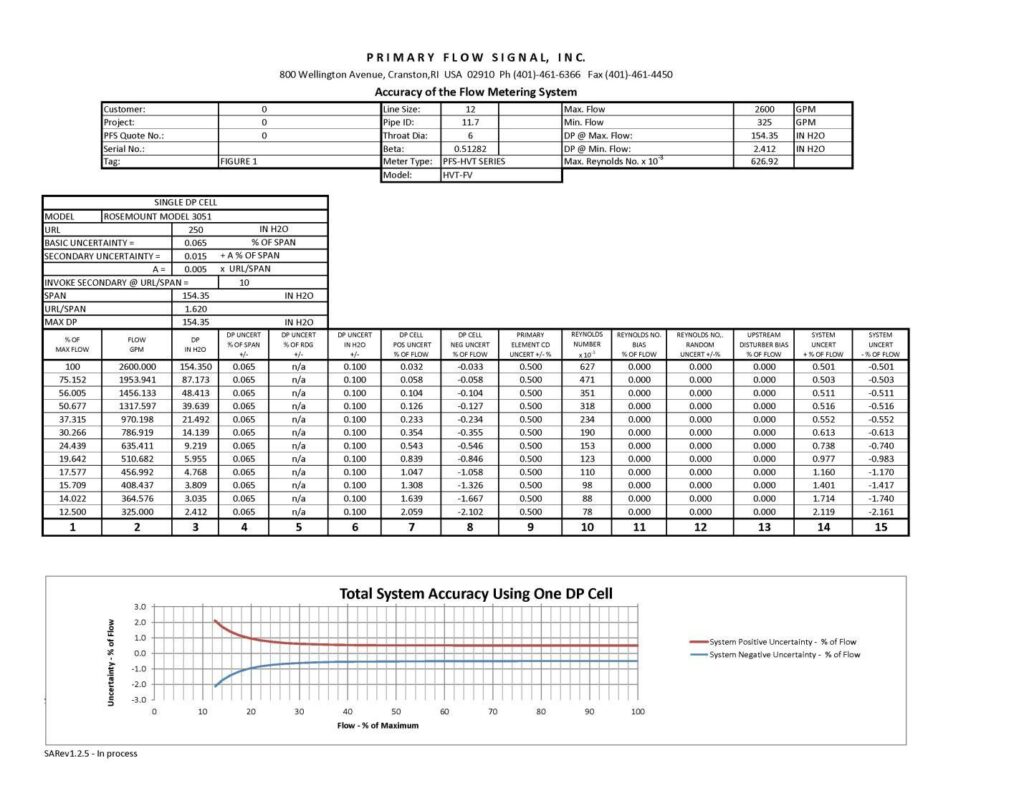
Columns 1 and 2 give the percent of maximum flow rate and the flow rate in gallons per minute (gpm).
Column 3 gives what the differential pressure produced by the Venturi meter is for the minimum-to-maximum flow rate.
Column 4 shows what the differential pressure transmitter uncertainty is as a percent of span (in this example, using a Rosemount 3051CD Differential Pressure Transmitter, which has a basic uncertainty of +/-0.04% of max calibrated span/full scale).
Column 5 is used only with certain differential pressure transmitter models and reflects the error as expressed in % of reading rather than % of span.
Column 6 provides the differential pressure transmitter uncertainty in “inches of water” form.
Columns 7 and 8 provide the differential pressure transmitters +/- uncertainty as a percent of flow. Now the standard differential pressure transmitter uncertainty statement has been converted from “percent of full scale” to “percent of actual rate of flow”, which is consistent with how the uncertainty of the Venturi meter is stated. Note that while the differential pressure transmitter uncertainty is +0.032/-0.033 at maximum flow rate, it changes to +2.059/-2.102 at the minimum flow rate because, while the accuracy of all differential pressure primary elements is always stated as a +/- % of actual rate of flow (down to the primary elements minimum pipe Rd requirement), all differential pressure transmitter accuracies are stated as a +/-% of max calibrated span or full scale, which means that the error contribution of the differential pressure transmitter increases as the flow rate/differential pressure drops. The exception to this rule is the Rosemount 3051S Ultra for Flow which specifies accuracy as a percent of reading.
Column 9 shows what the uncertainty of the primary element/Venturi meter is across the minimum-to-maximum flow rate range.
Column 10 gives the pipe Reynolds number over the minimum-to-maximum flow rate range. Note that there are a number of bias error sources to consider when using a Venturi meter (there are similar bias error sources for all measurement technologies), such as low pipe Reynolds number conditions and upstream straight pipe requirements.
Columns 11 and 12 provide the +/- bias and random errors that are the result of the pipe Reynolds number noted in Column 10 dropping below the minimum accepted for the specific Venturi meter design being considered.
Column 13 shows what the bias error is if there is not adequate straight upstream pipe. Note that with a modified, short form Venturi meter there is no downstream straight pipe requirement and the upstream requirement is considerably shorter than the classical Venturi meter design and is functionally tied to what the first upstream disturber is (elbow, reducer, tee, etc.) and what the beta ratio of the Venturi meter is (Beta is the ratio of throat size to line size d/D with the lower beta ratios requiring less straight pipe and the higher beta ratios requiring great upstream straight pipe. Generally, Venturi meter beta ratio’s range from 0.25 to 0.75.
Columns 14 and 15 provide what the integrated system accuracy is, based on the components noted in Columns 1 to 13.
Figure 2 shows us what the integrated system accuracy would be if the flow rate range were to be extended to 15:1 (325 to 5000 gpm) using the same Rosemount 3051CD Differential Pressure Transmitter.
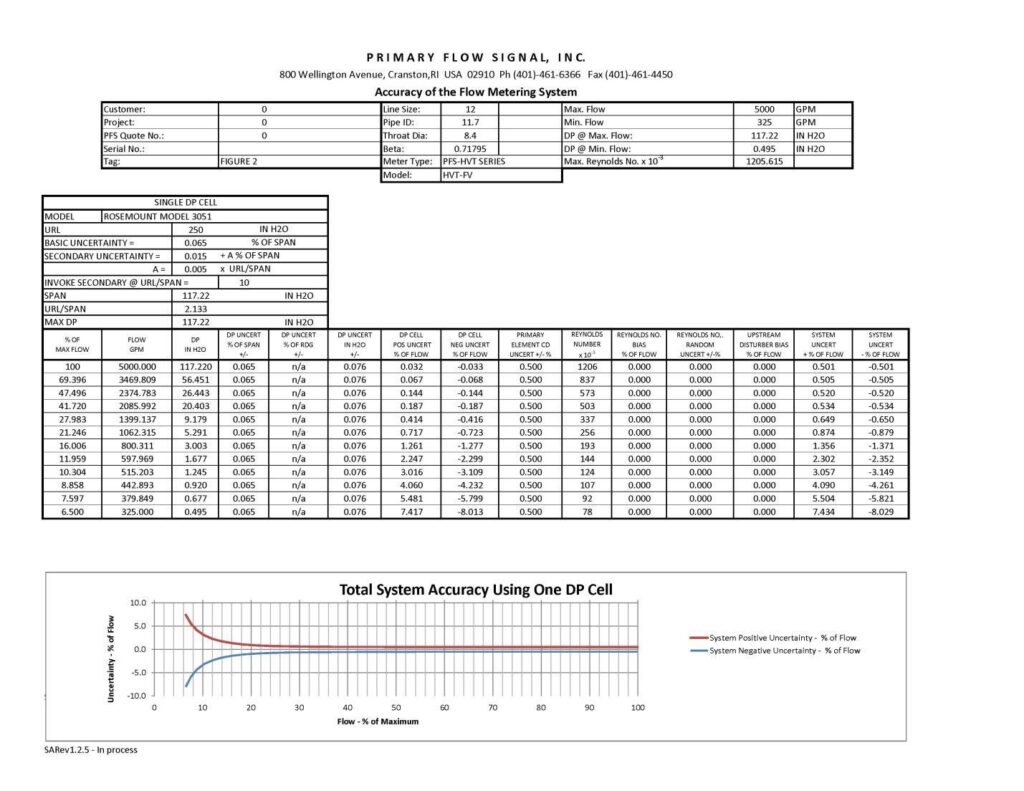
Note the change in differential pressure transmitter performance as noted in Columns 7 and 8. Rather than the +2.059 to -2.102 uncertainty for the transmitter based on 8:1 (Figure 1), the effect on the uncertainty performance of the differential pressure transmitter becomes apparent as the range extends to 15:1, which results in a minimum flow rate transmitter uncertainty of +7.434 and -8.029% of flow. If our expectation of total system accuracy over a 15:1 flow rate range is +/-<1.0% of actual rate of flow, clearly that requirement cannot be met with a single differential pressure transmitter system. Note also that the accuracy of the modified, short form Venturi remains constant at +/-0.5% of actual rate of flow.
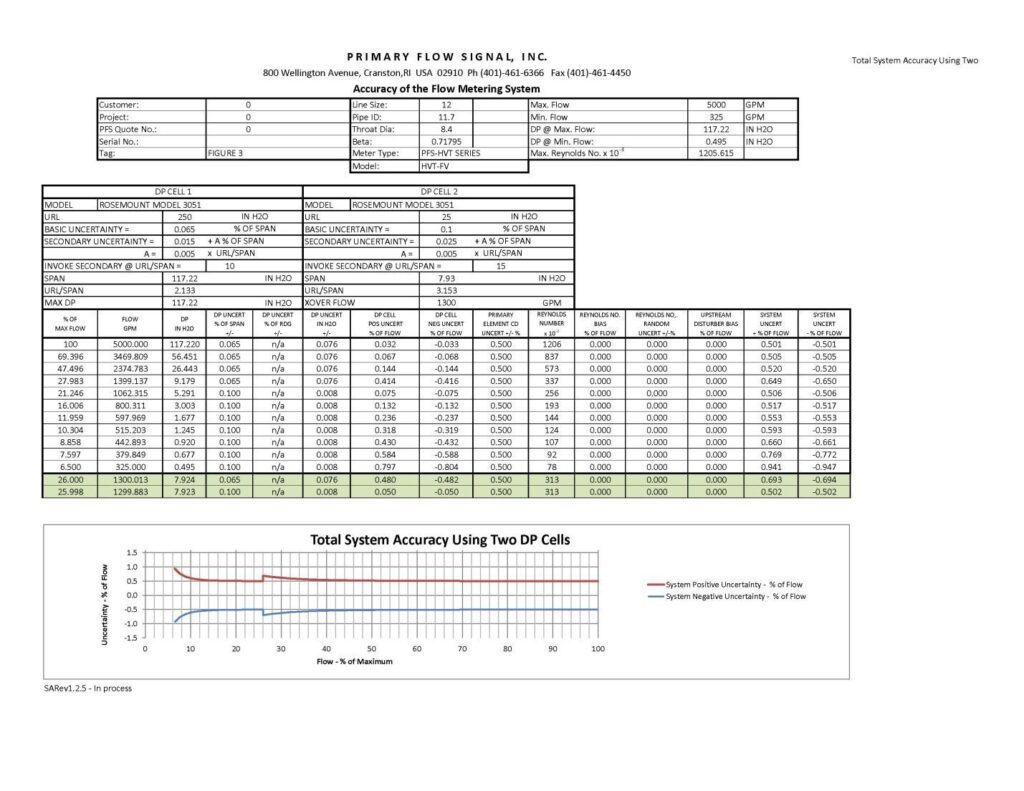
In order to meet a total system accuracy uncertainty level of <+/-1.0% of rate, process engineers must “split the flow rate range” (also known as stacking differential pressure transmitters) into two discrete elements: high and low flow rate ranges. Then, select the “range code” for the high and low transmitter’s best suited for and differential pressure range of the application. As an example, engineers can use the same differential pressure transmitter range code noted in Figure 1 for the high flow portion of the system, but introduce a low range differential pressure transmitter that has a maximum calibrated span of 25.0” of water column. The next challenge is to determine what the “crossover” point will be between processing the signal from the high or low range transmitter.
By simply calibrating the low range transmitter to a higher value, which changes the crossover point, the system accuracy performance can be modified and improved. Note also that the crossover point can be adjusted seasonally or based on changes in plant process requirements. The dual transmitter system can also be used as a diagnostic tool where a comparison of the output signals from both the high and low range transmitters at the crossover point will indicate that one of the transmitters is out of calibration. In Figure 3, it has been determined that the optimal crossover point is 26.0/25.998% of flow or approximately 1300 gpm, which, as noted in Figure 3 Columns 14 and 15, will result in a total system performance of better than +/-1.0% of actual rate of flow over the full range.
Another system design tool can be considered is to change the model of the differential pressure transmitter to one whose uncertainty performance has enhanced capabilities. Figure 4 provides an example of what happens to the system performance with a change from the Rosemount 3051CD Differential Pressure Transmitter (0.065% of span) to the Rosemount 3051S1CD Differential Pressure Transmitter with Ultra Performance Class (0.025% of span). We felt it was relevant to state the specific differences between the transmitters here to add clarification/understanding.
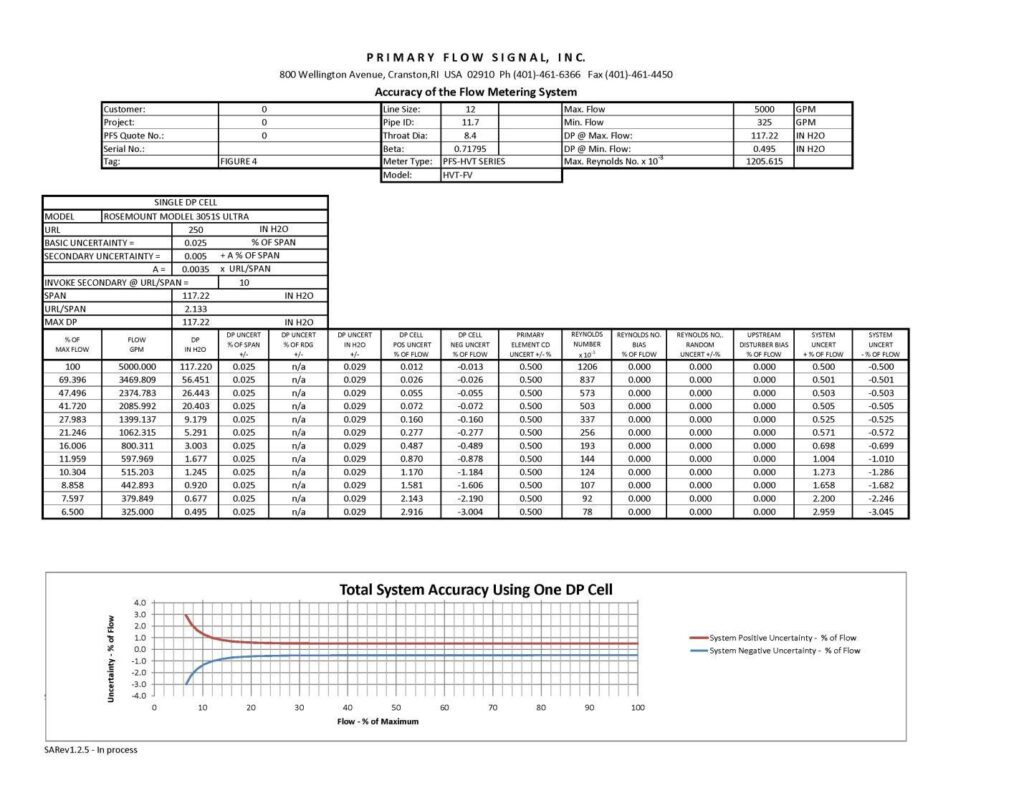
In Figure 2, it’s noted that the integrated system accuracy over a 15:1 flow rate range and using the Rosemount 3051CD Differential Pressure Transmitter was from +/-0.501% (at the maximum flow rate) to +7.434 to -8.029 % at the minimum flow rate. Figure 4 shows what happens to the system when replacing Rosemount 3051CD Differential Pressure Transmitter with the Rosemount 3051S1CD Differential Pressure Transmitter with Ultra Performance Class. The result improved to +/-0.5% of rate at the maximum flow to +2.959/-3.045% at the minimum flow rate. For instance, if the application requirement for system accuracy was +/-3.0% of rate, by changing the transmitter model, process engineers can achieve the desired performance with a single differential pressure transmitter.
Figure 5 shows what happens when changing to the Rosemount 3051S1CD Differential Pressure Transmitter with Ultra Performance Class (0.025% of span) and utilizing a split range or dual transmitter system. The crossover point remains best at 26.0% of max flow with the resulting system accuracy ranging from +/-0.5% at max rate to +0.875% to -0.879% at the minimum rate.
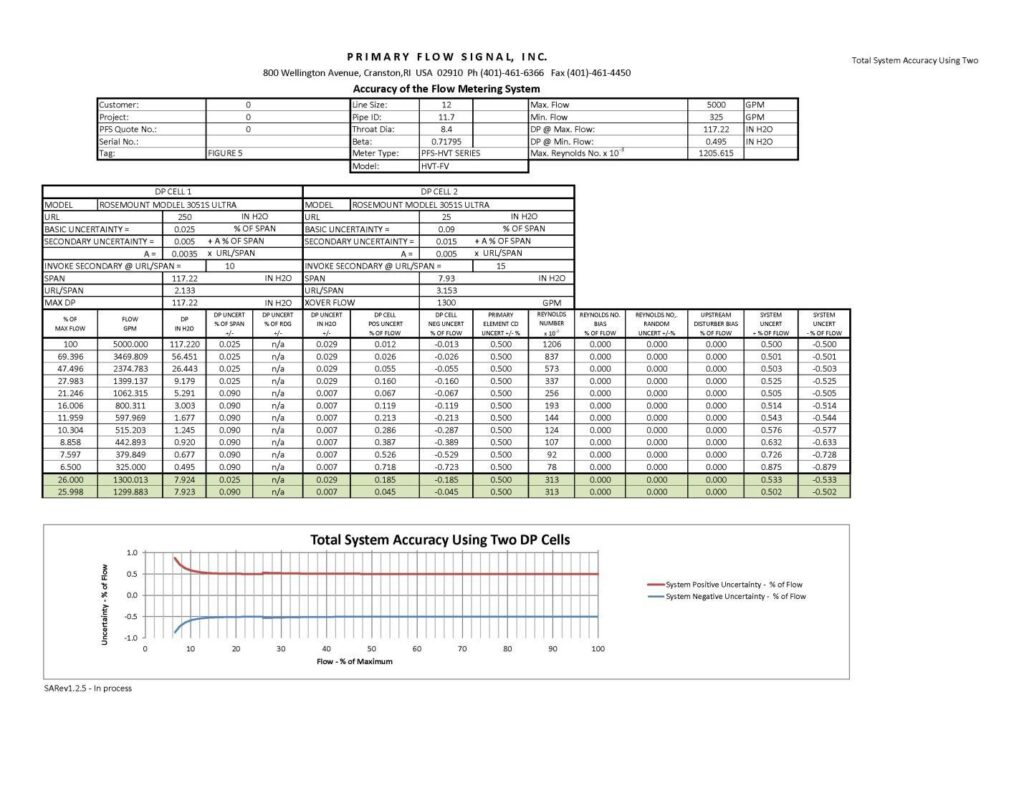
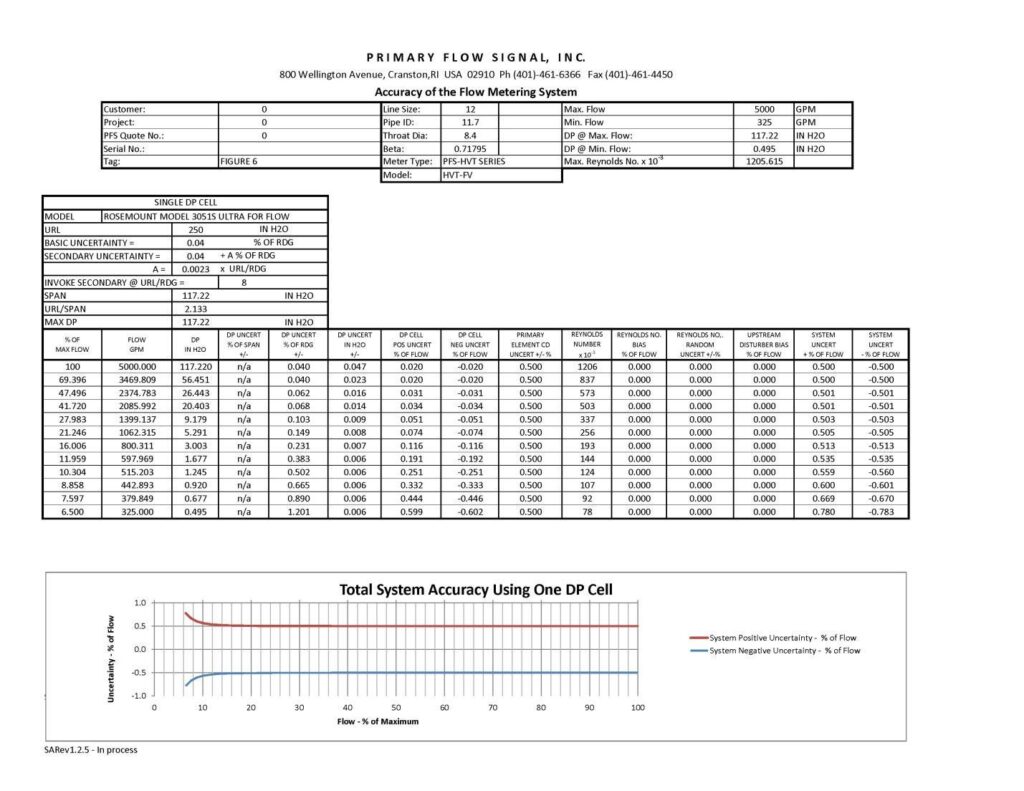
Figure 6 gives a final system design that provides better than +/-0.78% accuracy across the full 15:1 range by upgrading to the Rosemount 3051S3CD Differential Pressure Transmitter with Ultra for Flow Performance Class (0.04% of reading). Unlike the other transmitters that represent their accuracy/uncertainty as % of span, this transmitter has the ability to provide accuracy/uncertainty in % of reading.
While Figures 1-6 utilize a factory bench calibrated Venturi meter with +/-0.5% of rate accuracy, Figure 7 includes the same basic data (including the use of a Rosemount 3051S1CD Differential Pressure Transmitter with Ultra Performance Class) as Figure 4, but with a change to a lab calibrated +/-0.25% Venturi meter uncertainty. Based on the lab calibration of the Venturi meter, there is significant improvement in the system accuracy from about 12% to 100% of the application flow rates. However, at flows below about 12%, there is less improvement due to the differential pressure transmitter performance at and below this flow rate level.

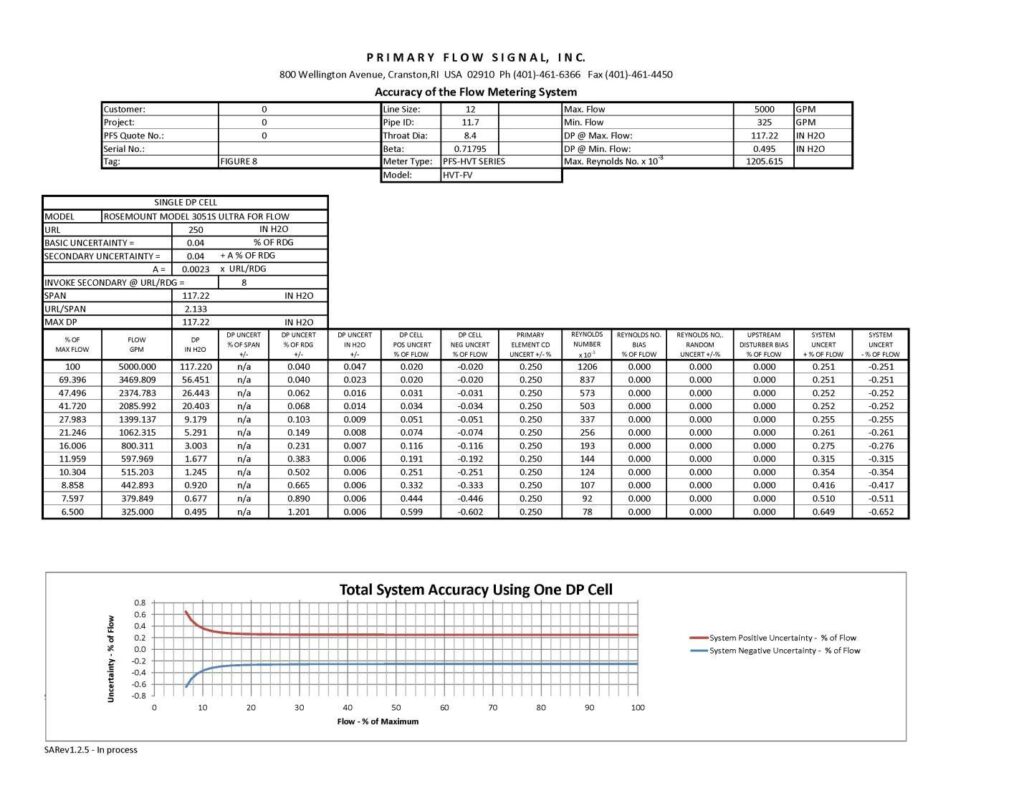
Figure 8 is the same as Figure 4, but includes a change to laboratory flow calibrated venturi (+/-0.25% uncertainty) and uses the Rosemount 3051S3CD Differential Pressure Transmitter with Ultra for Flow Performance Class. With these two changes to the system design, the system accuracy statement is just about +/-0.65% or better across the 15:1 range with an even greater level of accuracy at all flow rates save the lowest one.
Conclusion: Achieving Precision in Flow Metering with Differential Pressure Technology
- With proper analysis of the application requirements, including an understanding of what the system accuracy goal is, a Venturi metering system can be designed to suit most requirements effectively benefiting from the basic advantages of Venturi meter technology.
- The first step is to size the Venturi meter such that all of the application requirements are met in terms of range, differential magnitude, energy consumption, etc.
- Once the sizing process is completed, the selection of the best suited differential pressure transmitter can be accomplished using an integrated system accuracy program such as is presented in Figures 1-8. Choosing a high performance transmitter with % of reading accuracy delivers the best system performance.
- Adjustments to the overall system accuracy can then be made by including laboratory flow calibration or changing the differential pressure transmitter to one that has enhanced performance.
- If the example used in the figures above were a real application, our recommendation would be to use the system designed around Figure 8, which provides excellent accuracy performance with a single properly selected differential pressure transmitter. This proves the point that a wide range metering system using a Venturi primary element does not necessarily mean stacked transmitters; it means that a thought process must take place that leads the process design engineer to the conclusions presented for each option and, with the help of an Integrated System Accuracy Profile, success can be achieved.
- One example for the use of a wide range metering system analysis is when product loss issues arise and there is concern, as there frequently is, that some portion of the flow in the line is not being captured by the metering system. It may be simply a case of excessively high errors due to the minimum/maximum flow rate that is occurring as compared to the differential pressure transmitter being used. Stated another way, some portion of a product loss number that is higher than allowed may be easily corrected by a careful review of the secondary instrumentation.